Managed Mobility Services
Overview
Let us solve your toughest business challenges across every mobile lifecycle stage - planning, procurement, operations and disposal.
Procure and Provision
Place and manage all equipment orders and MACD service changes with total control and confidence.
Deploy
Ensure employees get to work quickly with forward and reverse logistics services for your mobile fleet.
Maintain
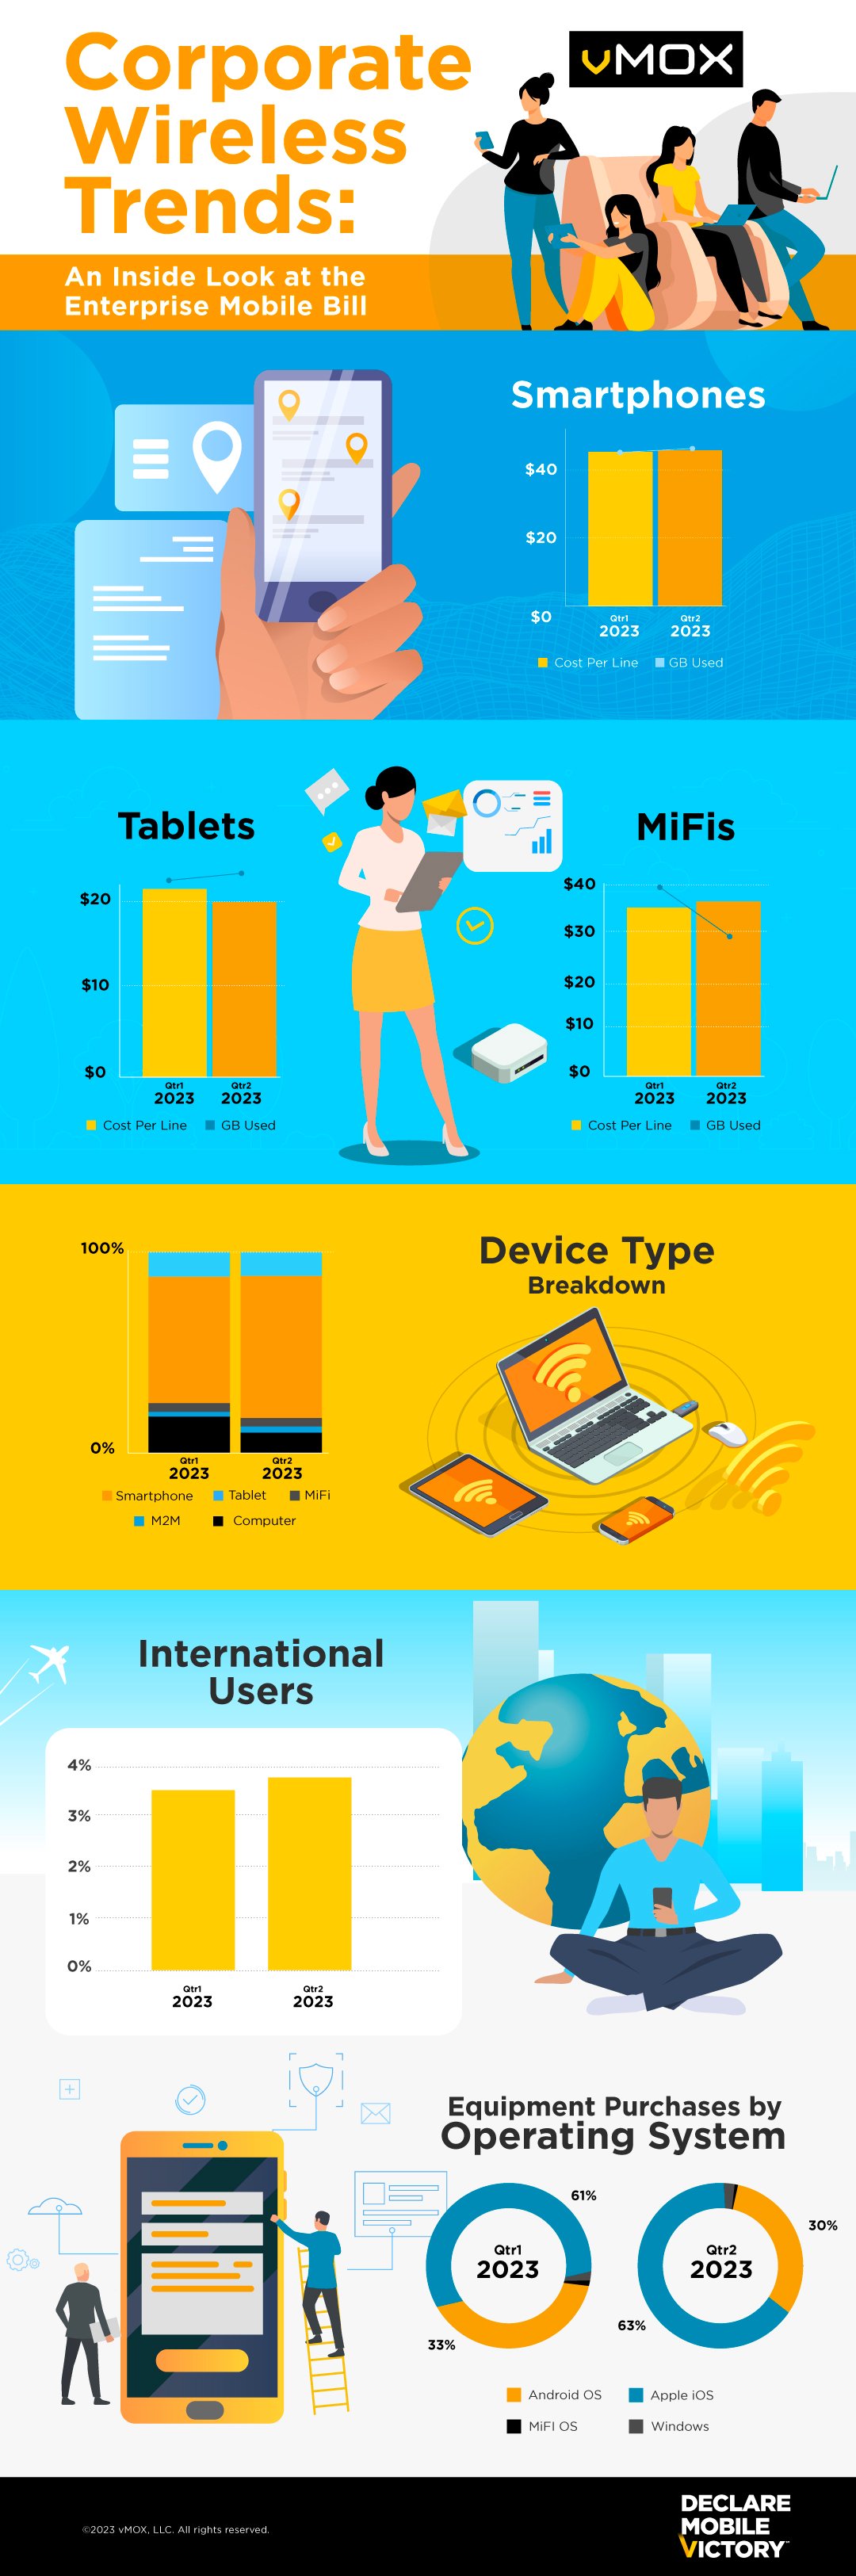
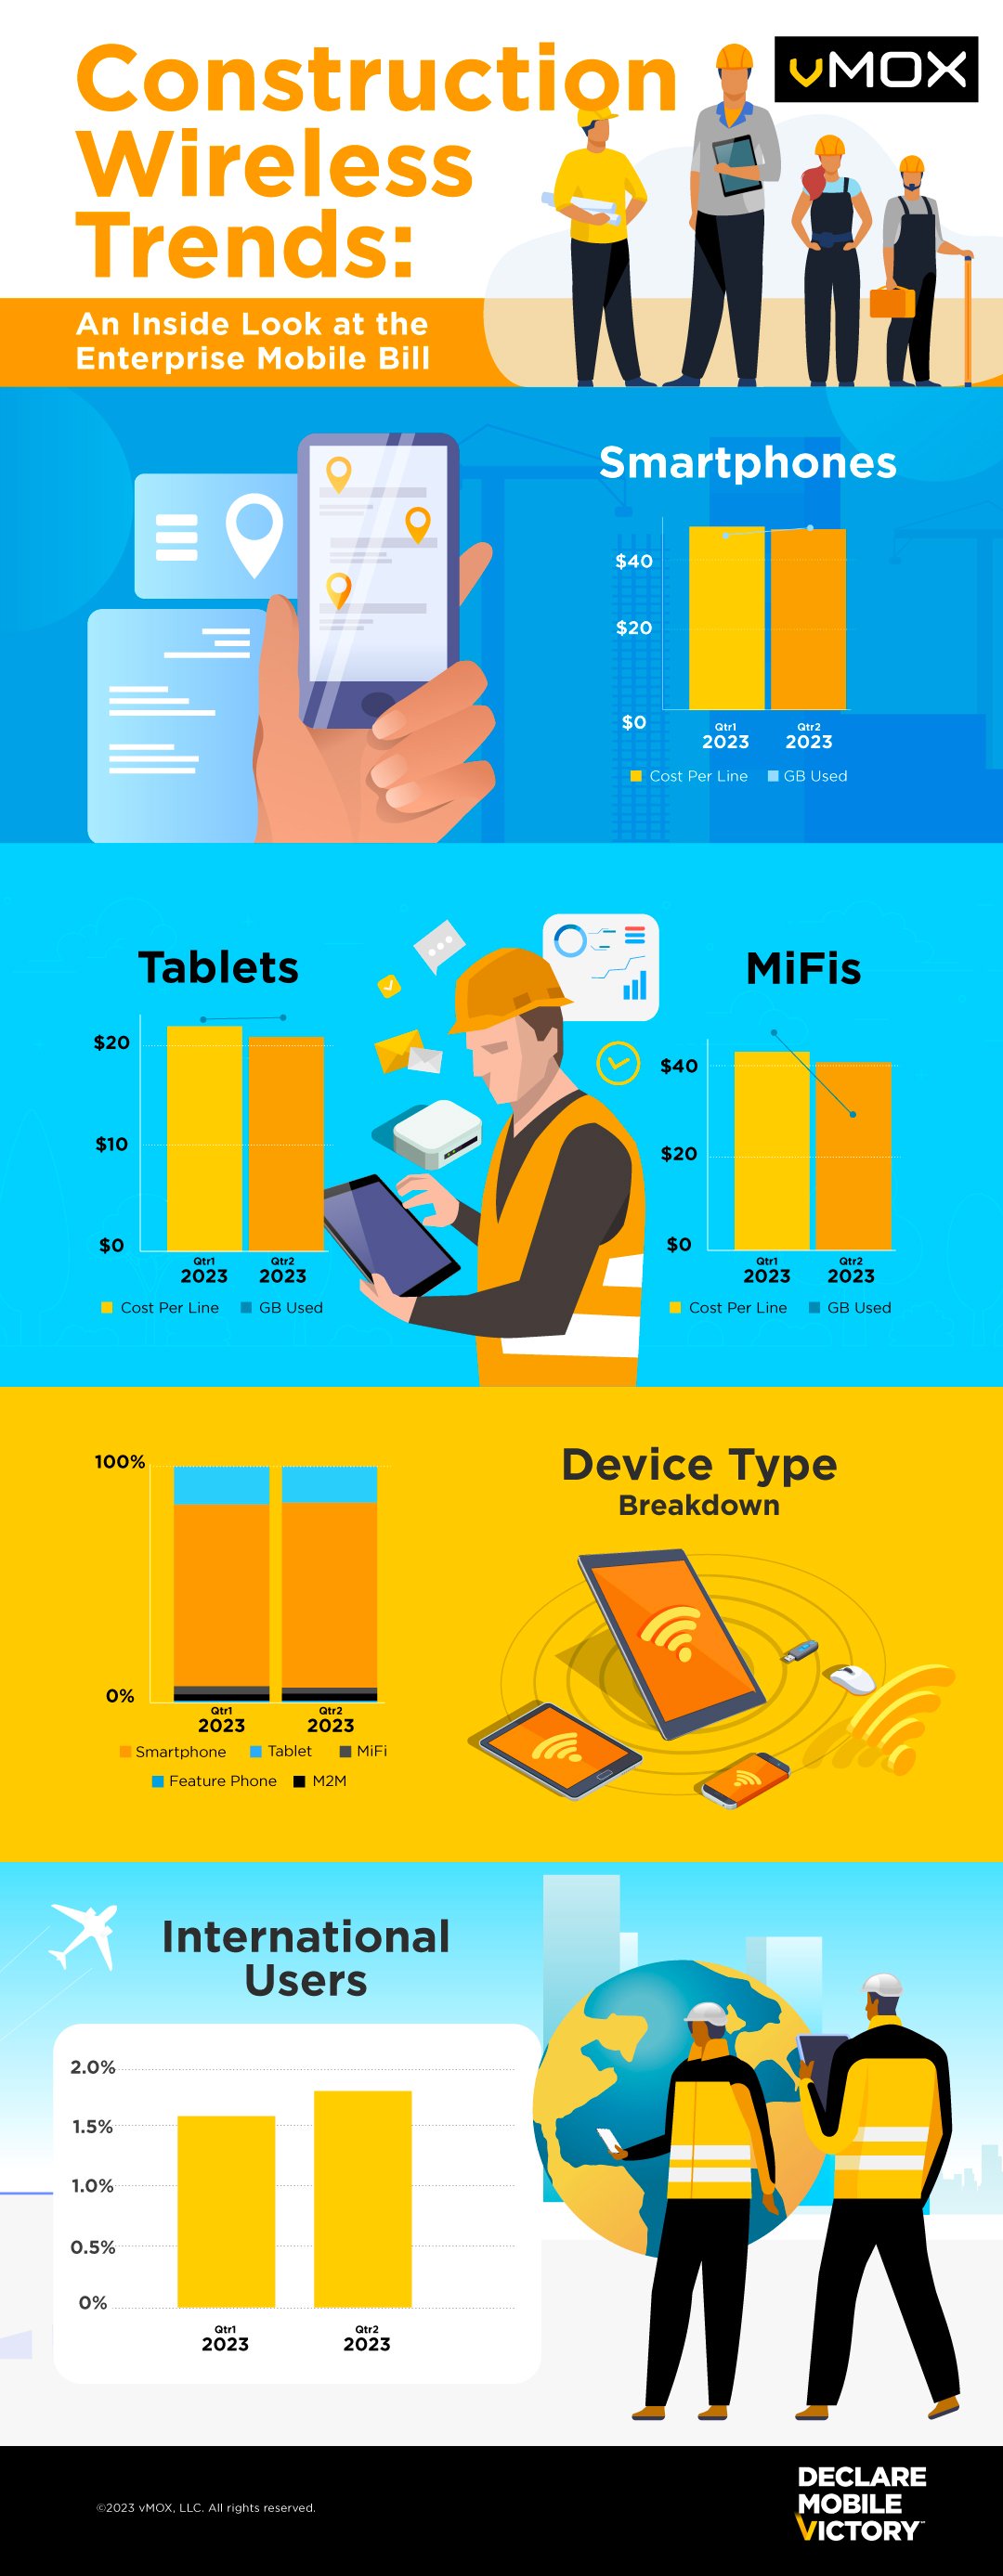
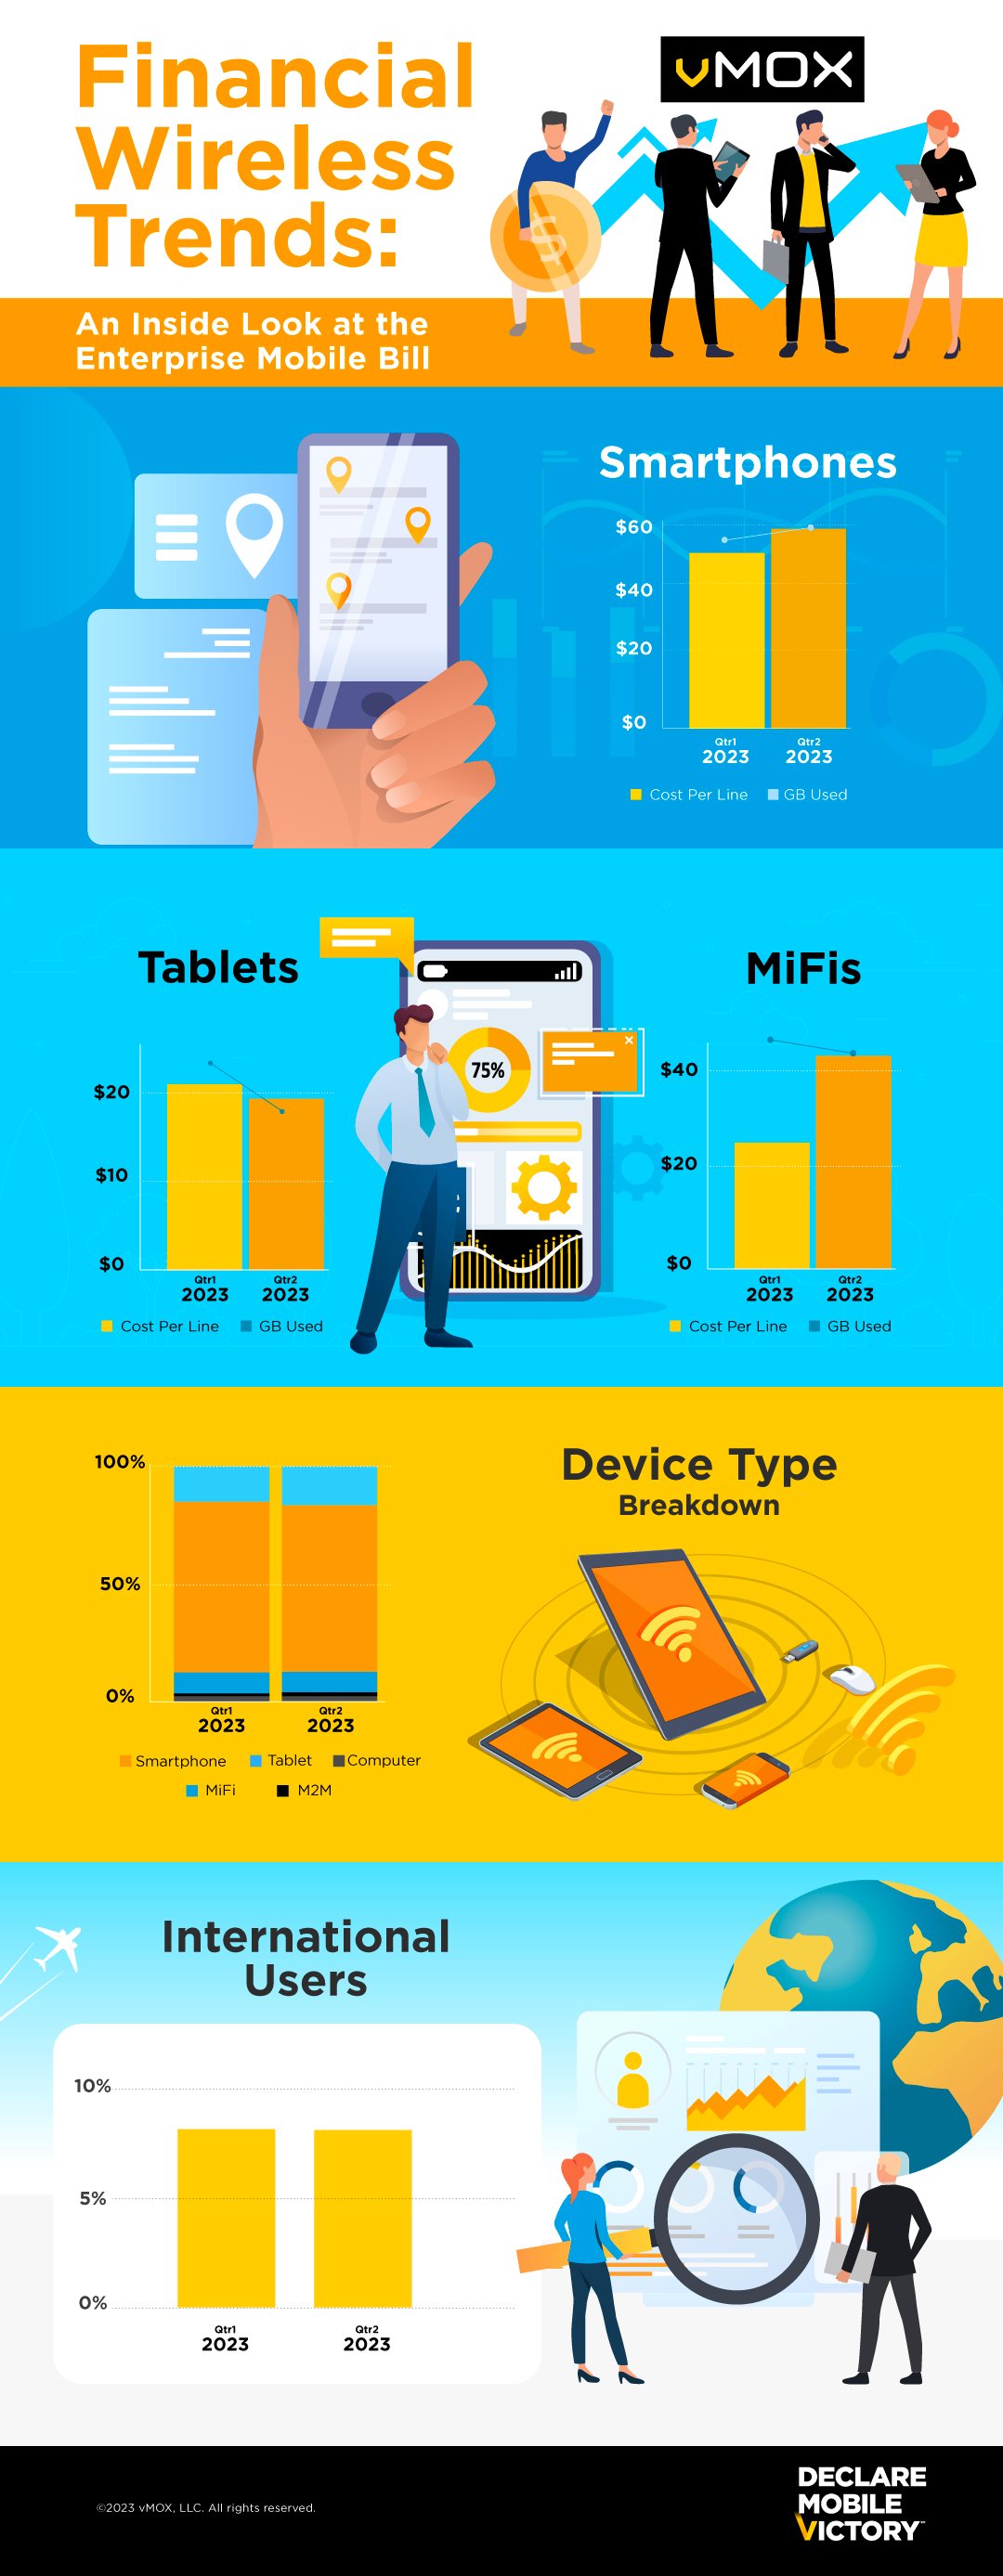
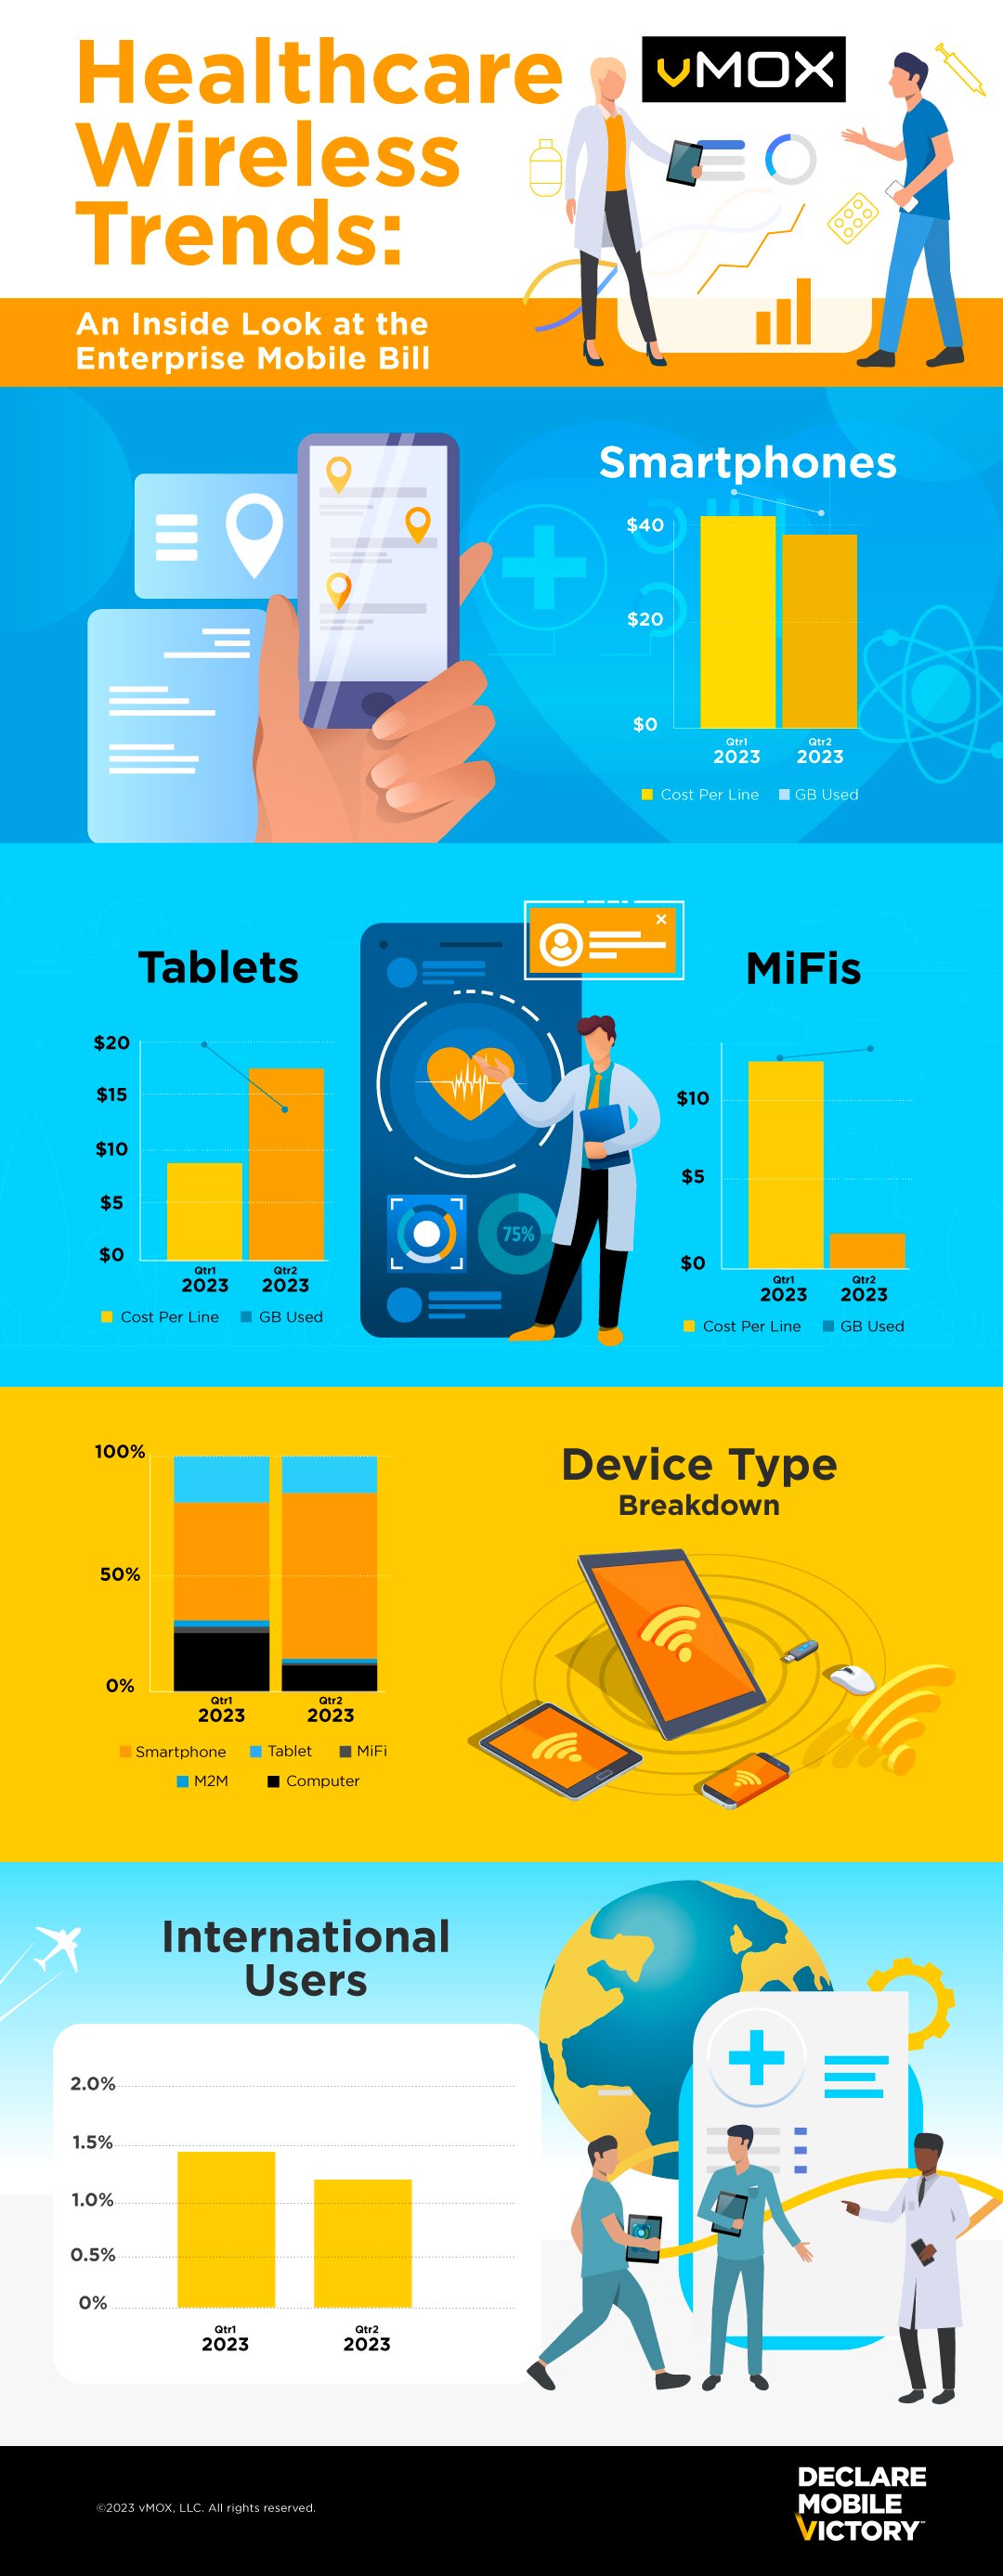
Centralize and optimize the management of your mobile assets, expenses and services. Save up to 40% on your wireless bills.
Secure
Protect all your endpoints and end users with advanced technology and expert managed services.
Plan and Support
Save time and money with guidance, workflow automation and an all-in-one end user service desk.
Go Global
Increase visibility and extend your enterprise mobility management across continents and carriers.
Laptop Lifecycle Services
Take expert care of your employee laptops with comprehensive lifecycle management.
WWAN Optimization and Lifecycle Management
Get a true picture of your SD-WAN environment and reduce your business costs.
Sustainability
Go green with services and strategies designed to reduce the impact of IT assets like smartphones, tablets and laptops.
Mobility Platform
Integrations and Automation
Integrate, automate and innovate so you can focus on what matters outside mobility.
OnePortalSM
One mobility platform to reduce your mobile costs, increase productivity and improve visibility.
Onboarding
Streamlined approaches to implementation, worry-free migrations and training for a smooth start.
Learn
Blog
Keep up with the world of business wireless with insights and articles from the experts.
Client Stories
Read inspiring stories of success and mobile victories from real clients in different sectors.
Podcast
Listen to industry leaders, get advice and track trends with the Road to Mobile Victory podcast.
Resource Library
Discover resources to expand your skills, solve wireless challenges and unlock value.
FAQs
Get answers to frequently asked questions about vMOX and the work we do in enterprise mobility.
Why Choose vMOX
Make your vendor selection with confidence. Find out what's unique about vMOX and why more enterprises are making the move.
Outsourcing vs. Insourcing
On fence about managed mobility services? Learn how IT outsourcing benefits your team and bottom line.
See How vMOX Compares
Wondering how vMOX stacks up? Explore what makes us different from other legacy solutions.